

DepotPerformanceCalculator
DepotPerformanceCalculator
Think global - Act local
- 4-in-1 Solution for using public market quotes within a local environment
- Languages English and German
- Multiple Cultures (Format of Number and Date)
- Multiple Currencies for definitions and evaluations
- Integration in existing workflow (Clipboard and neutral file formats)
Ready to explore with test data (Download)
Free for non-commercial and private use

DepotPerformanceCalculator
The DepotPerfomanceCalculator calculates the performance of Depots and Portfolios of various tradable securities with historic and current market quotes. Private data remain on the local system exclusively. It delivers various charts about the time-related performance development, report tables and report charts with a great number of settings.
The DepotPerformanceCalculator is not able to optimize a depot autonomously or even automatically. It is a tool to make visible the inner structures of a depot or portfolio in the best possible manner. Thereby the influences of price trends of the different securities, investment classes and currencies as well as the effects of revenues, expenses and interests with their complex interactions will be more easily recognizable. The transparency and overview that is thus obtained delivers better decision criteria for the depot management.
(Integral part of 4-in-1-Solution DepotPerformanceCalculator)

DepotList
- Depot definition in one or multiple DepotList files (tables)
- Loadable as single file or multiple added files combined
- Complete history of every item from "Buy" until "Sale"
- Depot booking in in multiple currencies (even mixable for
one item)
- Any number of Owners, Depotlabels, Classifications in one
file possible
- Free in booking all operations or main operations only for
less or more precesion (open table)
DepotList Operations
Buy, BuyExpense, BuyProvision,
Revenue, Expense, Tax
Break, DepotTransfer, Split
SaleExpense, SaleProvision, Sale
BrokenPeriod, PrecedingPeriod
Revenue, Expense, Tax
Break, DepotTransfer, Split
SaleExpense, SaleProvision, Sale
BrokenPeriod, PrecedingPeriod
Open, Close
BuyIn, BuyOut, ValueIn, ValueOut, ValueFix
DepotList Types
Stock, Fund, Bond, Certificate, Commodity
(Tradable securities)
Account, Clearing, Asset, Depot
(Private properties are consistently calculatable and evaluatable together with tradable securities)
Stock, Fund, Bond, Certificate, Commodity
(Tradable securities)
Account, Clearing, Asset, Depot
(Private properties are consistently calculatable and evaluatable together with tradable securities)
Account: Multiple currencies, credit account (negative saldo, interests)
Clearing: Special account flexible definable for owner, depotlable, currency and time period
Asset: Many types consistently representable, e.g. real estates, closed funds, life insurances etc.
Clearing: Special account flexible definable for owner, depotlable, currency and time period
Asset: Many types consistently representable, e.g. real estates, closed funds, life insurances etc.
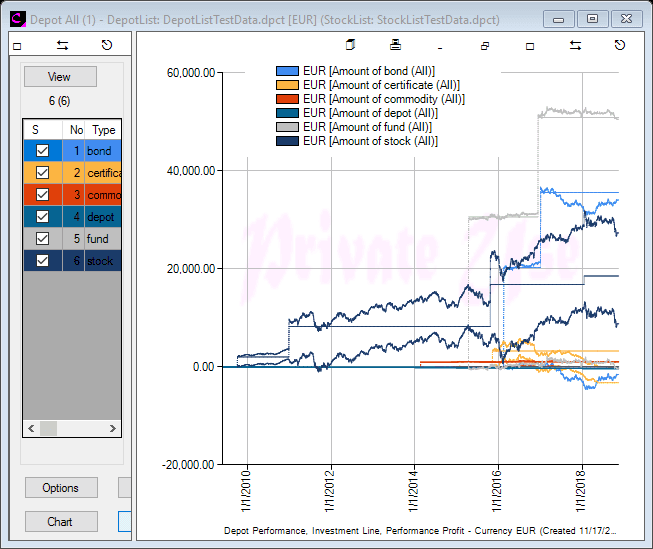
Chart
(dependent on time)
(dependent on time)
- Selectable are Performance, Performance-Profit, Inventory,
Investment Line, Revenues, Expenses, Profit, booked Taxes
- Investment Line: Fix, Constant Interest or Interest table
- Adjustable currency or currencies
- Adjustable beginning of evaluation
- Values absolute or relative in % of investment
- Graphic rendition: Continuouesly, Quaterly, Yearly,
Per Quarter, Per Year, Adjustable end of business year
- Optional overlaying of currencies and indices

Report Chart
(dependent on adjustable record date and period)
- Selectable are Performance, Performance-Profit, Inventory,
Revenues, Expenses, Profit, booked Taxes
- Charttypes Pie, Douhgnut, Column, Bar (each in 2D or 3D)
(dependent on adjustable record date and period)
- Selectable are Performance, Performance-Profit, Inventory,
Revenues, Expenses, Profit, booked Taxes
- Charttypes Pie, Douhgnut, Column, Bar (each in 2D or 3D)
Report Table
(dependent on adjustable record date and period)
- Large Table with a lot of columns for all values of
single items, groups of items and resulting amounts
- Viewable and copyable via clipboard in multiple cultures
(dependent on adjustable record date and period)
- Large Table with a lot of columns for all values of
single items, groups of items and resulting amounts
- Viewable and copyable via clipboard in multiple cultures
Improved Transparency and Overview
The functionality listed above allows enhanced flexibility to define complex structured and extensive depots. There are many different adjustments for the kind of results even combinable as well.
Two dialogs within the table panel are the control center to define the items and their arrangement to show.


"View" defines the items or groups displayed in the table panel. Items to view can be selected by single check, checking all, selecting Categories or using Filter. The groups of (All or Selected) items are selectable according to various default or free definable grouping criteria.
In the second step displayed items or groups can be selected by single checks, checking all, selecting Categories or using Filter (of dialog "Select"). All selected items or groups visible in the table panel will be calculated and viewed in charts or result tables.
Allmost anything can be combined with each other. Just a few clicks to change the point of view to details or summaries, single items or groups, to amounts or to amounts en total. Easy to use but powerful. In conjunction with all other flexibility that improves transperency and overview of a depot.

Simulation
- Adjustments for existing item types and currencies, e.g.
Target Date 11/17/2019
stock 80 (% of last quote in emission currency)
fund 85 (% of last quote in emission currency)
bond 100 (% of last quote in emission currency)
certificate 20 (% of last quote in emission currency)
commodity 120 (% of last quote in emission currency)
EUR/CHF 1,1 (quote)
EUR/USD 1,02 (quote)
- All features, adjustments, chart types etc. are applicable
for the time period of simulation as well
Checks DepotList
Formal Plausibility
Formal Plausibility
A DepotList can be reviewed for plausibility additionally. In doing so conspicuous features will be flagged to control them individually. Not existing ancillary expenses of buy or sale operations could be forgotten while booking. Or else they were settled with the quotes of buy or sale and not shown explicitly as expenses.
Data Plausibility
In a depot booked quotes or used currency exchange rates can be compared with the respective market rates. Conspicuous values can be filtered by adjustable tolerances for deviations to control them individually.
Exemplarily some more features
Table Panel
- Search and Filter with wildcards
- Context menus header cells for table layout, sorting etc.
- Context menus table cells for viewing of data tables,
calling web info etc.
Table Panel
- Search and Filter with wildcards
- Context menus header cells for table layout, sorting etc.
- Context menus table cells for viewing of data tables,
calling web info etc.
Chart Panel
- Zoom
- Setting of markers displaying point values by hovering
- Many adjustments of titles and legends
- Context menus for adjustment of visibility, colors,
exploding etc.
Limitations
The DepotPerformanceCalculator has no interfaces to trading tools. The Interface of depot definitions are DepotList files (documented). Conversion functionality for other proprietary interfaces are not implemented.
On page "Download" test data with multiple examples is available. Ready to explore.